Hypocampus is a site for Medical students built on Cortexio.
Hypocampus started HT 2016 and steadily grew to a little over 1000 users until the turn of the year. Fortunately, the number of new users has continued to flow in, and we now have, after first half of 2017, ended just over 4,000 users – Medical students, AT doctors, Doctors with overseas European degree, Physicians and Specialist doctors.
So it is not just our click farm in Nepal that generates traffic.
At Hypocampus.se anonymous data is collected to see how the system is used and to be able to improve it. Here comes some fun graphics, first out is the number of sessions. (A session starts each time a user visits the page, and ends when the user has been inactive for a few hours.)
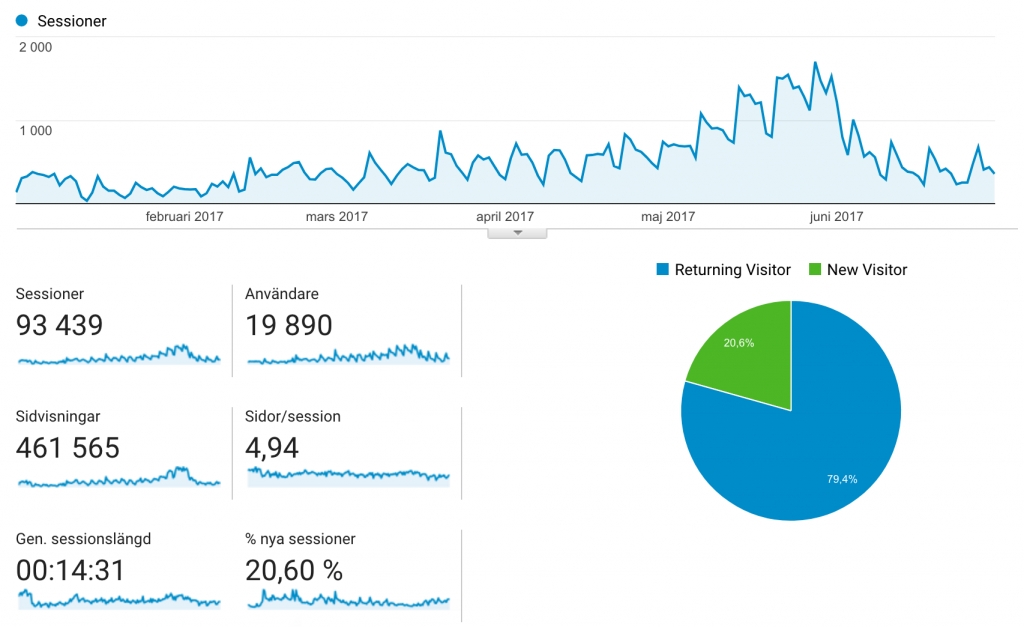
You can see a clear bump in the number of sessions at the end of the semester.
We can also get statistics on how many page views are delivered to users. Here, the statistics are a little more difficult to interpret since a page view when the user, for example, answers questions is not counted for each page.
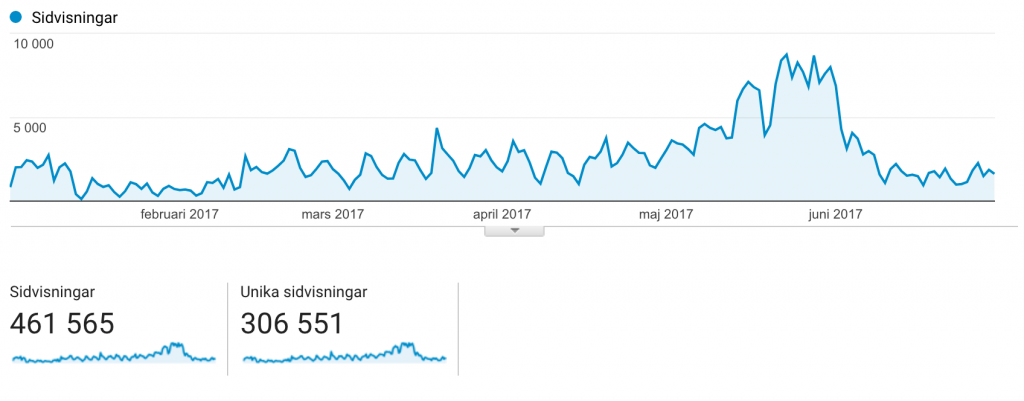
Here we see the same clear trend with more and more page views until the end of the semester.
The number of events in the system is one that is captured when, for example, the user clicks the Answer button on questions or the Save button on notes.
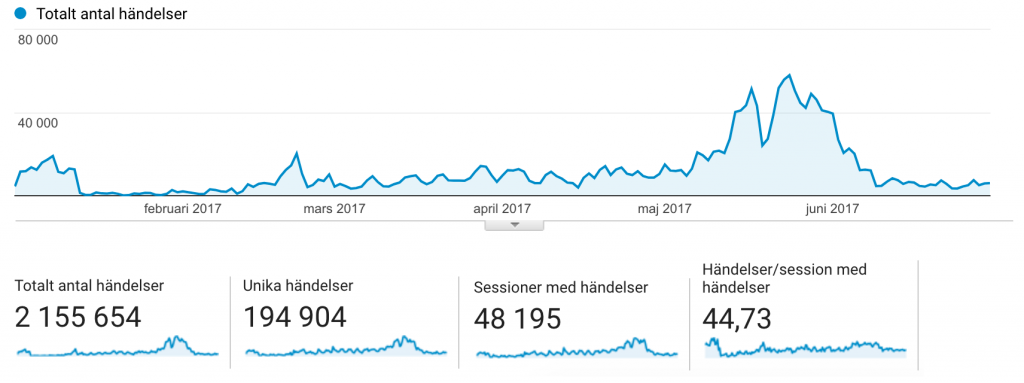
Here we see an even clearer trend of users making the most questions in connection with the exam. Hopefully, there is a slightly rising trend in answering questions between the exams – we all know that if the knowledge is to be stuck in the memory it must be activated as soon as possible – for example with questions: https://blog.cortexio.se/2016/09/29/test-enhanced-learning/
Have a good summer wish the Cortexio / Hypocampus gang!